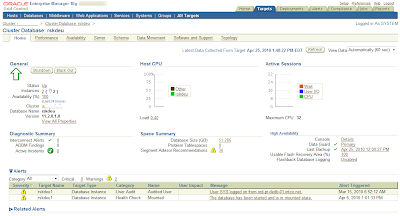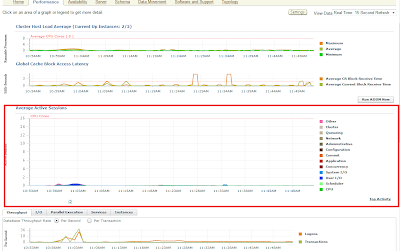
Click on the Performance tab and look at the average active sessions.

Click on the wait class that you would like more detail on (in this case cpu)
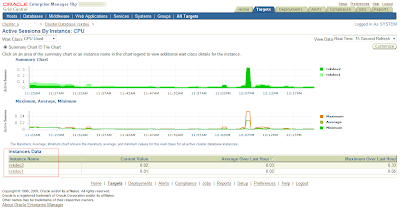
This takes us to Active Sessions by Instance. Here we can drill down on each instance.

Click on one of the Instance listed.

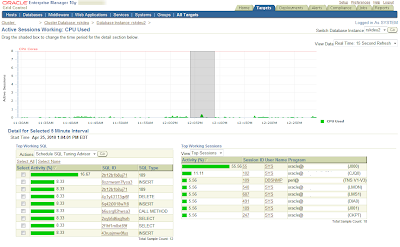
In the Active Sessions graph, click and drag the grey bar to the selected period.
On the bottom left we see the “Top Working SQL” for the 5 minute period we selected.
On the bottom left we see the “Top Working SQL” for the 5 minute period we selected.
To the right of this we can view what/who is initiating the top working sql.
We can view this by Sessions, Services, Modules, Actions, Clients and PLSQL.
******************************************
keywords: OEM performance active sessions
******************************************
rdbms version: 11G
******************************************
No comments:
Post a Comment