Showing performance details for high load sql statements.
Navigate to the database performance tab and click on Sql Monitor

This takes us to an overview of the sql statements that Oracle has deemed as high load.

Then we can drill down on the details for each statement
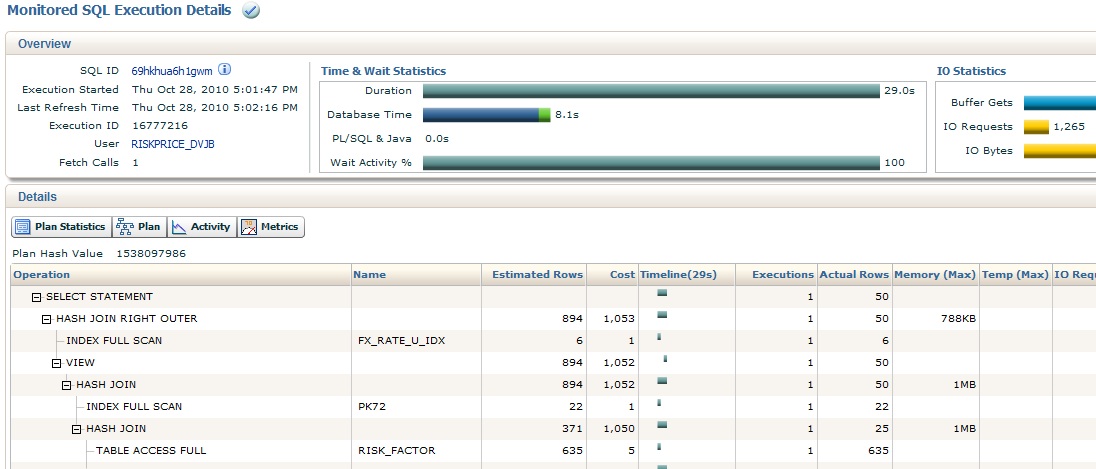
Note the estimated rows and actual rows columns.
To force Oracle to run sql monitor on a specific query add the +MONITOR hint.
select /*+MONITOR*/ BUSINESS_DAY_ID, ACTIVE, BUSINESS_DATE
from business_day
where active = 'Y';
Now of course we need to be able to run something similar in sqlplus.
DBATEST@tccdv2eu>select /*+MONITOR*/ BUSINESS_DAY_ID, ACTIVE, BUSINESS_DATE
2 from business_day
3 where active = 'Y';
BUSINESS_DAY_ID A BUSINESS_DATE
--------------- - --------------------
2468 Y 18-OCT-2010 00:00:00
1 row selected.
DBATEST@tccdv2eu>set long 10000000
DBATEST@tccdv2eu>set longchunksize 10000000
DBATEST@tccdv2eu>set linesize 200
DBATEST@tccdv2eu>select dbms_sqltune.report_sql_monitor from dual;
REPORT_SQL_MONITOR
-------------------------------------------------------------------------------------SQL Monitoring Report
SQL Text
------------------------------
select /*+MONITOR*/ BUSINESS_DAY_ID, ACTIVE, BUSINESS_DATE from business_day where active = 'Y'
Global Information
------------------------------
Status : DONE (ALL ROWS)
Instance ID : 1
Session : DBATEST (436:19760)
SQL ID : 70zk8ppsmytyh
SQL Execution ID : 16777218
Execution Started : 10/28/2010 17:33:04
First Refresh Time : 10/28/2010 17:33:04
Last Refresh Time : 10/28/2010 17:33:04
Duration : .000411s
Module/Action : SQL*Plus/-
Service : SYS$USERS
Program : sqlplus@rv-dv-dedb-01 (TNS V1-V3)
Fetch Calls : 2
Global Stats
==================================================
| Elapsed | IO | Other | Fetch | Buffer |
| Time(s) | Waits(s) | Waits(s) | Calls | Gets |
==================================================
| 0.00 | 0.00 | 0.00 | 2 | 17 |
==================================================
SQL Plan Monitoring Details (Plan Hash Value=3656625771)
================================================================================
| Id | Operation | Name | Rows | Cost | Time | Start
| | | | (Estim) | | Active(s) | Active
================================================================================
| 0 | SELECT STATEMENT | | | | 1 | +0
| 1 | TABLE ACCESS FULL | BUSINESS_DAY | 727 | 4 | 1 | +0
================================================================================
1 row selected.
******************************************
keywords: sql monitor
******************************************
rdbms version: 11g
******************************************
No comments:
Post a Comment